A must-have tool for desktop data processing and analysis esProc Desktop

  1. What is esProc Desktop?
  2. What does esProc solve?
  3. How to do these now?
  4. esProc Desktop!
  5. SPL IDE
  6. SPL XLL
  7. SPL WIN
  8. Case

What is esProc Desktop?

Programming Language

that can be learned by non-professionals
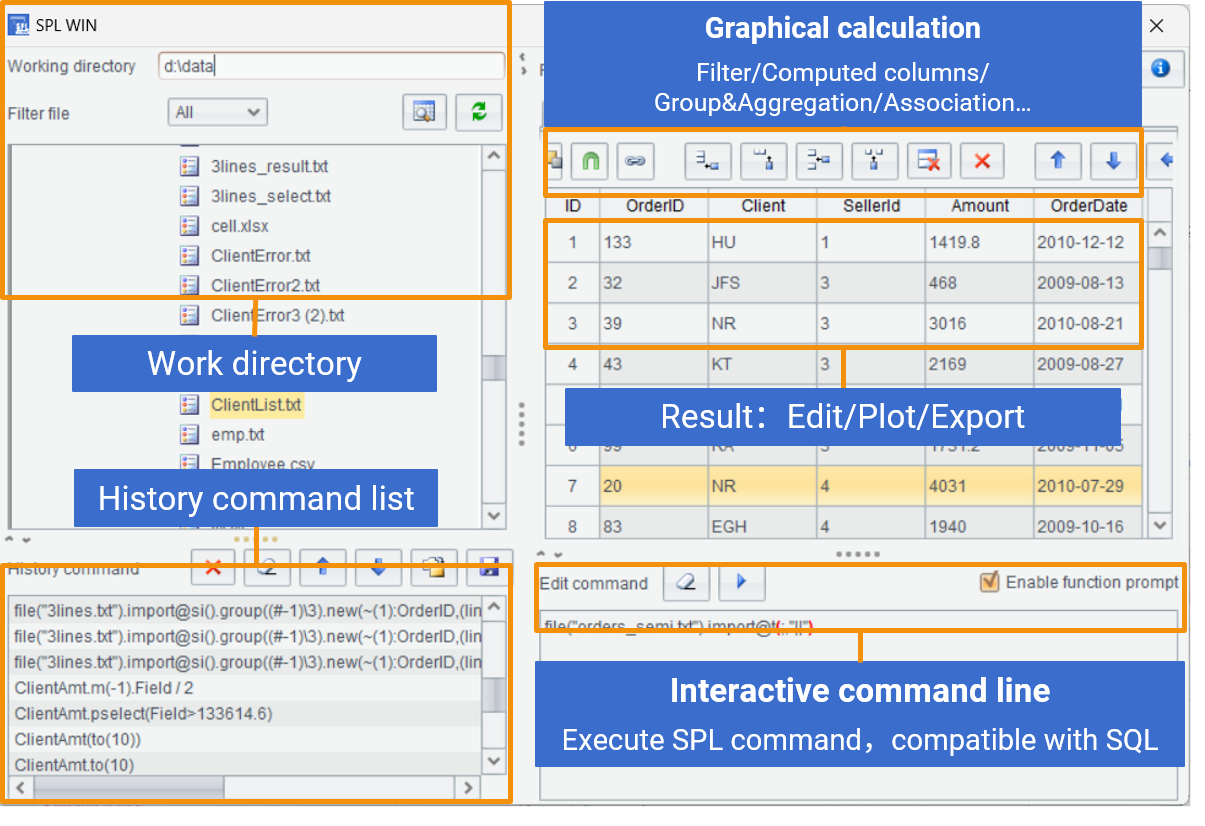
Toolkits

for desktop data analysis and processing

What does esProc solve?

  • Complex calculations and transformations that are difficult to do directly in Excel
  • Multi-step interactive data analysis that BI software cannot perform
  • Repetitive processing batch files (xls/csv/...) on hand (querying/calculating/generating/converting)

How to do these now?

Excel

Simple operation, rich functions

Tedious batch and repetitive tasks

Insufficient support for complex operations

Turn to BI? Tableau / PowerBI / Qlik / TIBCO / Objects BI …

Simple to use, smooth and beautiful interface

Single calculation, can only do rigid multidimensional analysis

Turn to programming? VBA

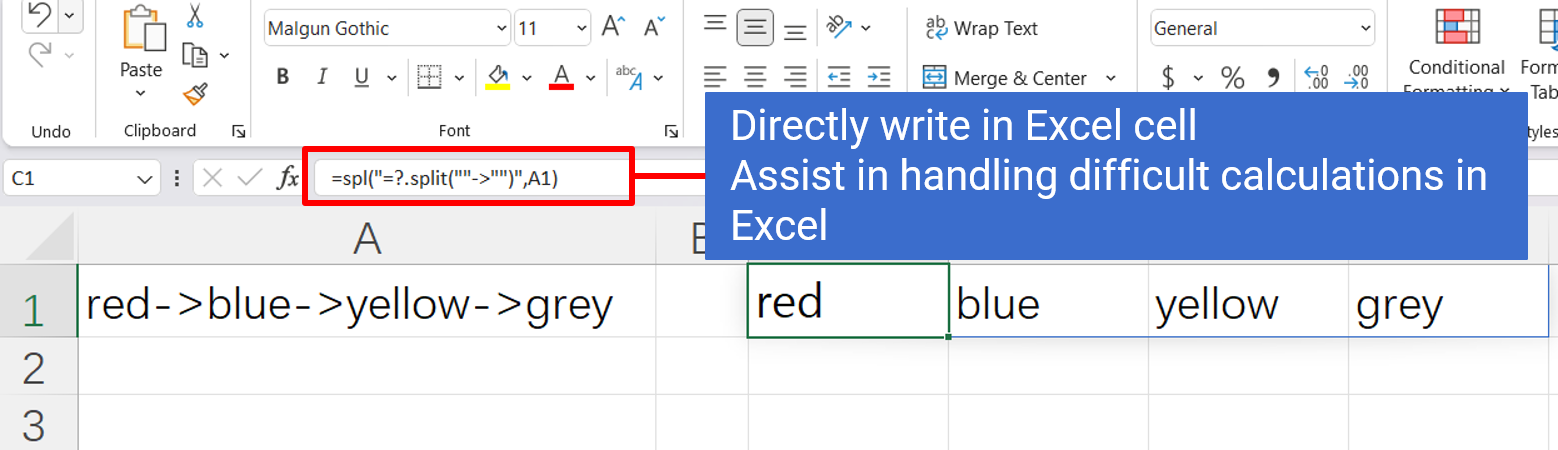
Full programming capabilities, naturally built in Excel

Poor support for table calculations, large section of code for simple tasks

Turn to programming? Python

Support table calculation, good interactivity, training courses everywhere

Table calculation does not conform to natural thinking
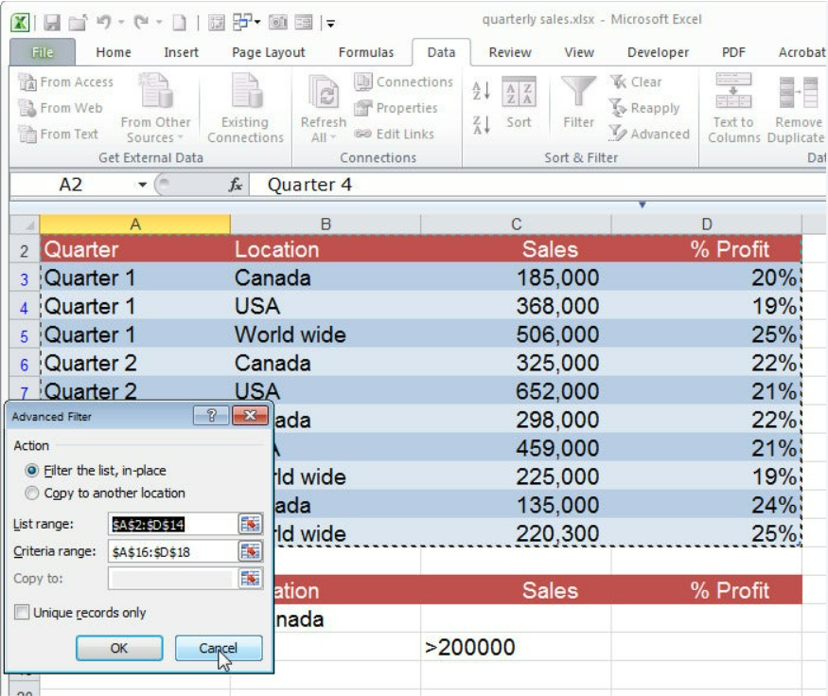
Too many types of tables need to be mastered
The difficulty is far beyond non-professionals

df = pd.read_csv("../login_data.csv")
df["ts"] = pd.to_datetime(df["ts"]).dt.date
grouped = df.groupby("userid")
aligned_dates = pd.date_range(start=df["ts"].min(), end=df["ts"].max(), freq='D')
user_date_wether_con3days = []
for uid, group in grouped:
    group = group.drop_duplicates('ts')
    aligned_group = group.set_index("ts").reindex(aligned_dates)
    consecutive_logins = aligned_group.rolling(window=7)
    n = 0
    date_wether_con3days = []
    for r in consecutive_logins:
        n += 1
        if n<7:
            continue
        else:
            ds = r['userid'].isna().cumsum()
            cont_login_times = r.groupby(ds).userid.count().max()
            wether_cont3days = 1 if cont_login_times>=3 else 0
            date_wether_con3days.append(wether_cont3days)
    user_date_wether_con3days.append(date_wether_con3days)
arr = np.array(user_date_wether_con3days)
day7_cont3num = np.sum(arr,axis=0)
result = pd.DataFrame({'dt':aligned_dates[6:],'cont3_num':day7_cont3num})

Turn to database? SQL

True set of records, with interactivity

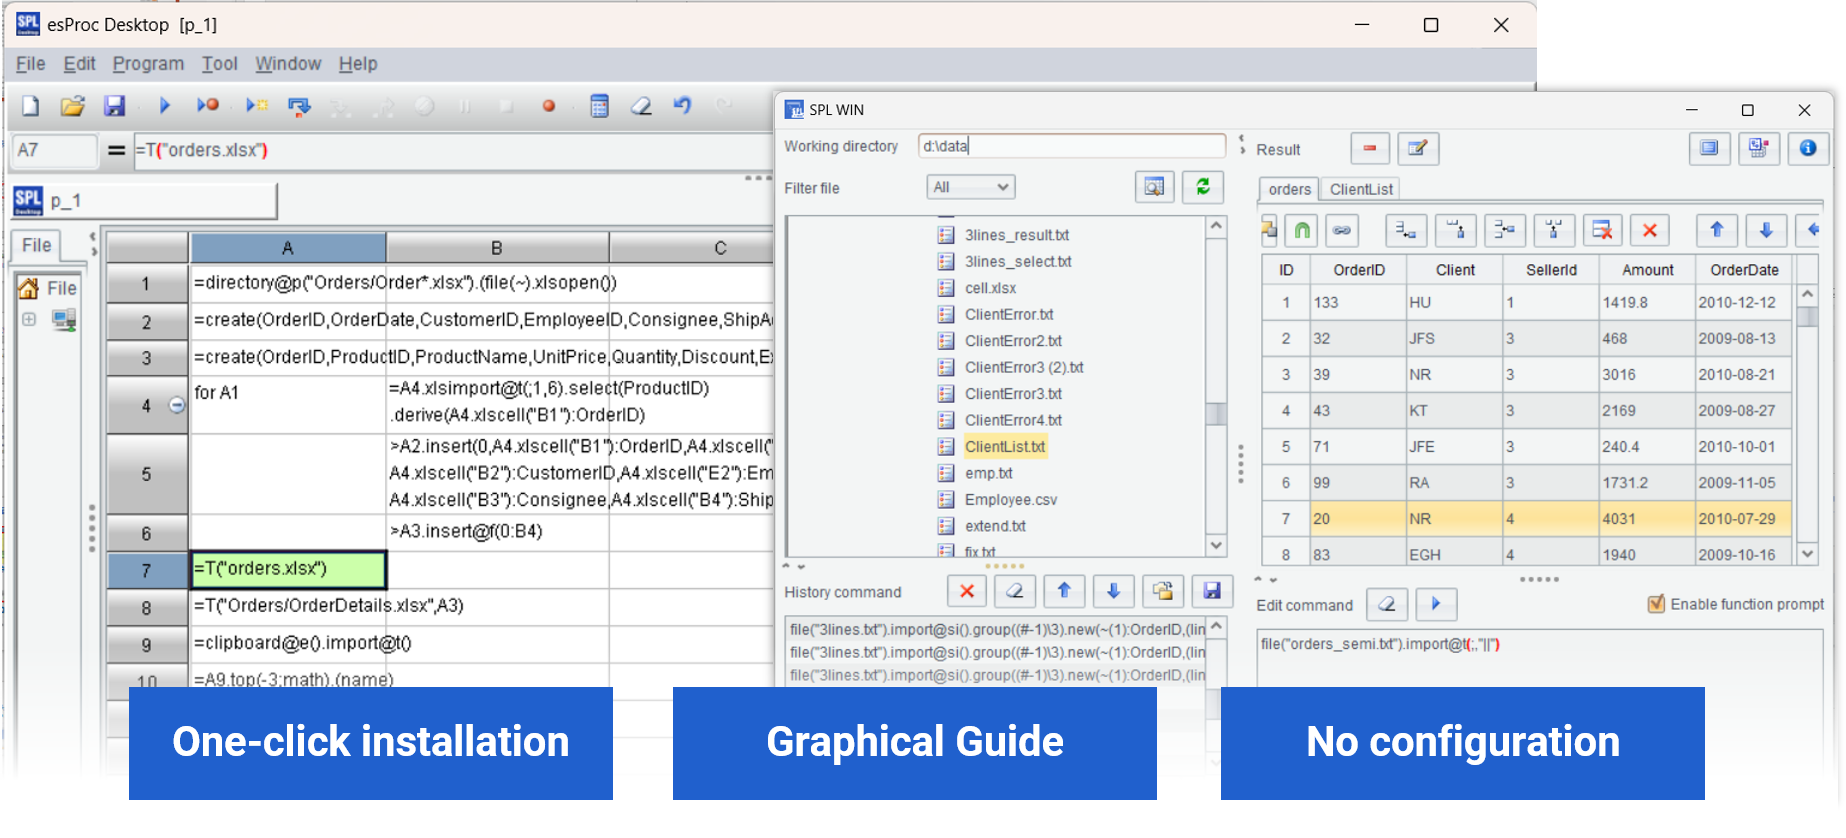
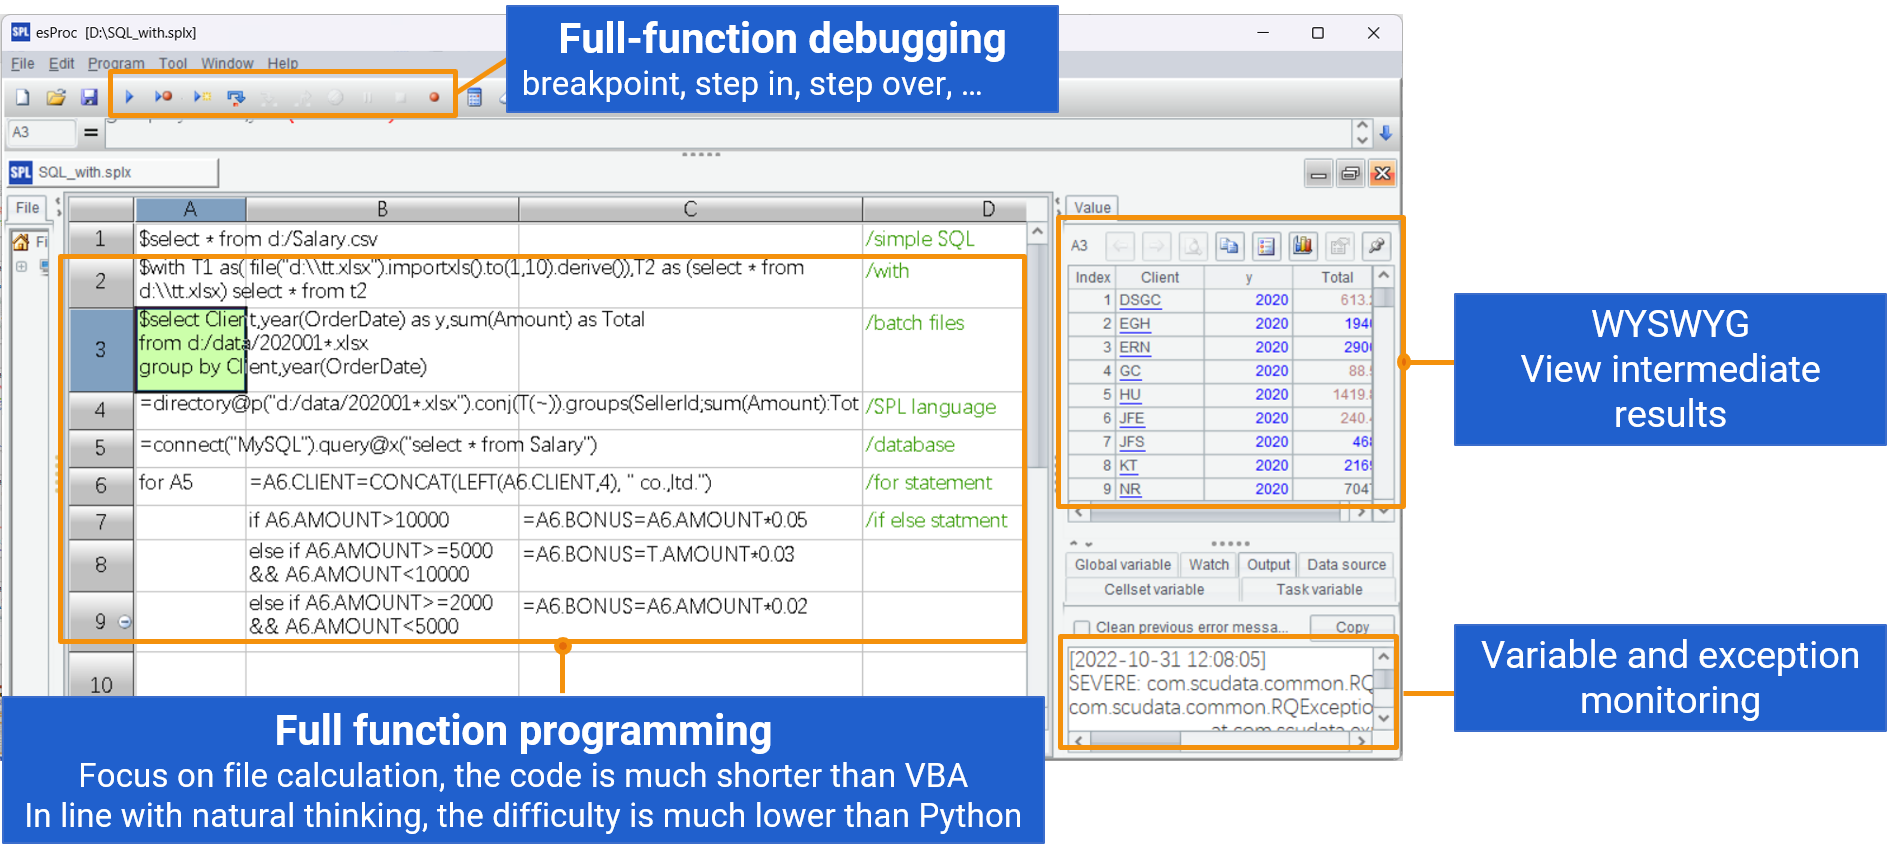
Complex environment, cannot directly process desktop files, too hard for non-professionals to use

The complexity of procedural calculation is too high for non-professionals to master

WITH all_dates AS (
	SELECT DISTINCT TRUNC(ts) AS login_date
	FROM login_data),
user_login_counts AS (
	SELECT userid, TRUNC(ts) AS login_date, 
		(CASE WHEN COUNT(*)>=1 THEN 1 ELSE 0 END) AS login_count
	FROM login_data
	GROUP BY userid, TRUNC(ts)),
whether_login AS (
	SELECT u.userid, ad.login_date, NVL(ulc.login_count, 0) AS login_count
	FROM all_dates ad
	CROSS JOIN (
		SELECT DISTINCT userid
		FROM login_data) u
	LEFT JOIN user_login_counts ulc
	ON u.userid = ulc.userid
	AND ad.login_date = ulc.login_date
	ORDER BY u.userid, ad.login_date),
whether_login_rn AS (
	SELECT userid,login_date,login_count,ROWNUM AS rn 
	FROM whether_login),
whether_eq AS(
	SELECT userid,login_date,login_count,rn,
		(CASE 
			WHEN LAG(login_count,1) OVER (ORDER BY rn)= login_count 
				AND login_count =1 AND LAG(userid,1) OVER (ORDER BY rn)=userid 
			THEN 0 
			ELSE 1 
		END) AS wether_e	
	FROM whether_login_rn
),
numbered_sequence AS (
	SELECT userid,login_date,login_count,rn, wether_e,
		SUM(wether_e) OVER (ORDER BY rn) AS lab
	FROM whether_eq),
consecutive_logins_num AS (
	SELECT userid,login_date,login_count,rn, wether_e,lab,
  		(SELECT (CASE WHEN max(COUNT(*))<3 THEN 0 ELSE 1 END)
   		FROM numbered_sequence b
   		WHERE b.rn BETWEEN a.rn - 6 AND a.rn
		AND b.userid=a.userid
   		GROUP BY b. lab) AS cnt
	FROM numbered_sequence a)
SELECT login_date,SUM(cnt) AS cont3_num
FROM consecutive_logins_num
WHERE login_date>=(SELECT MIN(login_date) FROM all_dates)+6
GROUP BY login_date
ORDER BY login_date;

esProc Desktop!

Plug & Play, Non-professionals can play it independently

Structured data oriented

Structured Process Language
Conside code, far better than VBA, SQL, and Python
A
1 =file("login_data.csv").import@tc()
2 =periods(date(A1.ts),date(A1.m(-1).ts))
3 =A1.group(userid).(~.align(A2,date(ts)).(if(#<7,null,(cnt=~[-6:0].group@i(!~).max(count(~)),if(cnt>=3,1,0)))))
4 =msum(A3).~.new(A2(#):dt,int(~):cont3_num).to(7,)
  • Native support for structured data
  • True set records, only one type of set
  • Compute desktop files directly
  • Complete programming capability
  • Simplify complex calculations and lower the technical threshold of data analysis

Excellent Table Processing

Merge, aggregate and split

  • Merge table with same columns
  • Merge and delete duplicated columns
  • Merge and aggregate duplicated columns
  • Append and accumulate data to summary
  • Split by categories or rows
  • ……

Set operations and belongingness judgment

  • The intersection, union, and difference of simple members
  • The intersection, union, and difference on uncertain number of sets
  • Judge equality and belongingness between sets
  • ……

Special grouping and aggregation

  • Group every N members
  • Group by adjacent data
  • Group by empty or non-empty rows
  • Group by data interval
  • Concatenate same group of data into text
  • ……

Expand and complement

  • Generate continuous intervals
  • Convert one row to multiple rows
  • Split text into multiple rows
  • Fill in missing parts in continuous values
  • Fill up a number of blank row every N rows
  • ……

Searching and filtering

  • Find position of a certain value
  • Filter by location
  • Find the first and last data
  • Find the maximum and minimum Values
  • Select the top N and last N
  • ……

Duplicates judgment, counting and deleting

  • Find duplicate values
  • Count the number of duplicates
  • Remove paired data
  • Deduplicate row-based data
  • Deduplicate without changing original order
  • ……

Association and comparison

  • Association through a table
  • Interval association
  • Use tow-dimensional association table
  • Use interval range to look up association table
  • Associate multiple rows
  • ……

Operations on text and datetime

  • Split a text into multiple
  • Extract number and date
  • Split into words
  • Calculate overlapped time interval
  • Generate consecutive Sundays
  • ……

Calculate cell value and aggregation value

  • Calculate by adjacent rows and intervals
  • Cumulate with possible early termination
  • Calculate cumulative value in categories
  • Add aggregation of same category
  • Split summary into detail rows
  • ……

Sorting and Ranking

  • Align data in specified order
  • Align data with duplicates in specified order
  • Concatenate members of same ranks
  • Sorting in category
  • Ranking in category
  • ……

Conversion between rows and columns

  • Rows to fixed columns
  • Convert row-style table and cross table
  • Convert row-column upper classification
  • Put data in category into columns
  • Re-categorize data when put into columns
  • ……

File extraction and generation

  • Extract data from uncertain rows
  • Extract data from specified cells
  • Extract data from mixed-style structure sheet
  • Fill in specified cells
  • Generate card-style sheets
  • ……

SPL IDE

Full-featured data computing IDE

Coding in grid

SPL XLL

Plug-in to enhance Excel computing capability

SPL WIN

Desktop data interactive computing tool

Case

Find out the star products that are in the top10 every month

SPL XLL: Calculate in Excel directly

Transpose the table from column to row

SPL XLL: Process in Excel directly

Monthly sales of each model, then LRR and YOY

SPL WIN:Multi-step interactive analysis

1. Group by model, month, year and count

2. Calculate YOY: if(Model==Model[-1] && Month==Month[-1],SalesVol/SalesVol[-1],null)

3. Resort by model, year, month

4. Calculate LRR: if(Model==Model[-1] ,SalesVol/SalesVol[-1],null)

Associate spreadsheets and calculate actual wages

Wage = StandardWages*(1+Evaluation-Absence/40)+Bonus
SPL WIN:Multi-step interactive calculation

1. Load 3 spreadsheets

2. Associate standard with absent and performance

3. Calculate wage according to the formula

Complement missing data in Excel: use mode for integer columns and average for floating-point columns

SPL IDE: Code implements loop and judgment logic
A B C
1 =file("data.xlsx").xlsimport@t()
2 for A1.fname() =A1.field(A2)
3 =B2.sum() =B2.sum(int(~))
4 =if(B3==C3,B2.mode(),B2.avg())
5 =B2.(if(~,~,B4)) >A1.field(A2,B5)
6 >file("dataNew.xlsx").xlsexport@t(A1)

Extract row-data from a batch of card-type XLS files

SPL IDE:Concise code parses XLS files with complex format
A B C
1 [ID,Name,Sex,Postion,Birthday,Phone,Address,PostCode]
2 [C1,C2,F2,C3,C4,D5,C7,C8]
3 =directory@p("data/*.xlsx")
4 for A3 =file(A4).xlsopen() =B2.(B4.xlscell(~))
5 =@|C4
6 =create(${A1.concat@c()}).record(B5)
7 >file("all.xlsx").xlsexport@t(A6)